

The dashboard
See first what needs attention, then a brand's passports, items, scan map and model completeness.
On this page
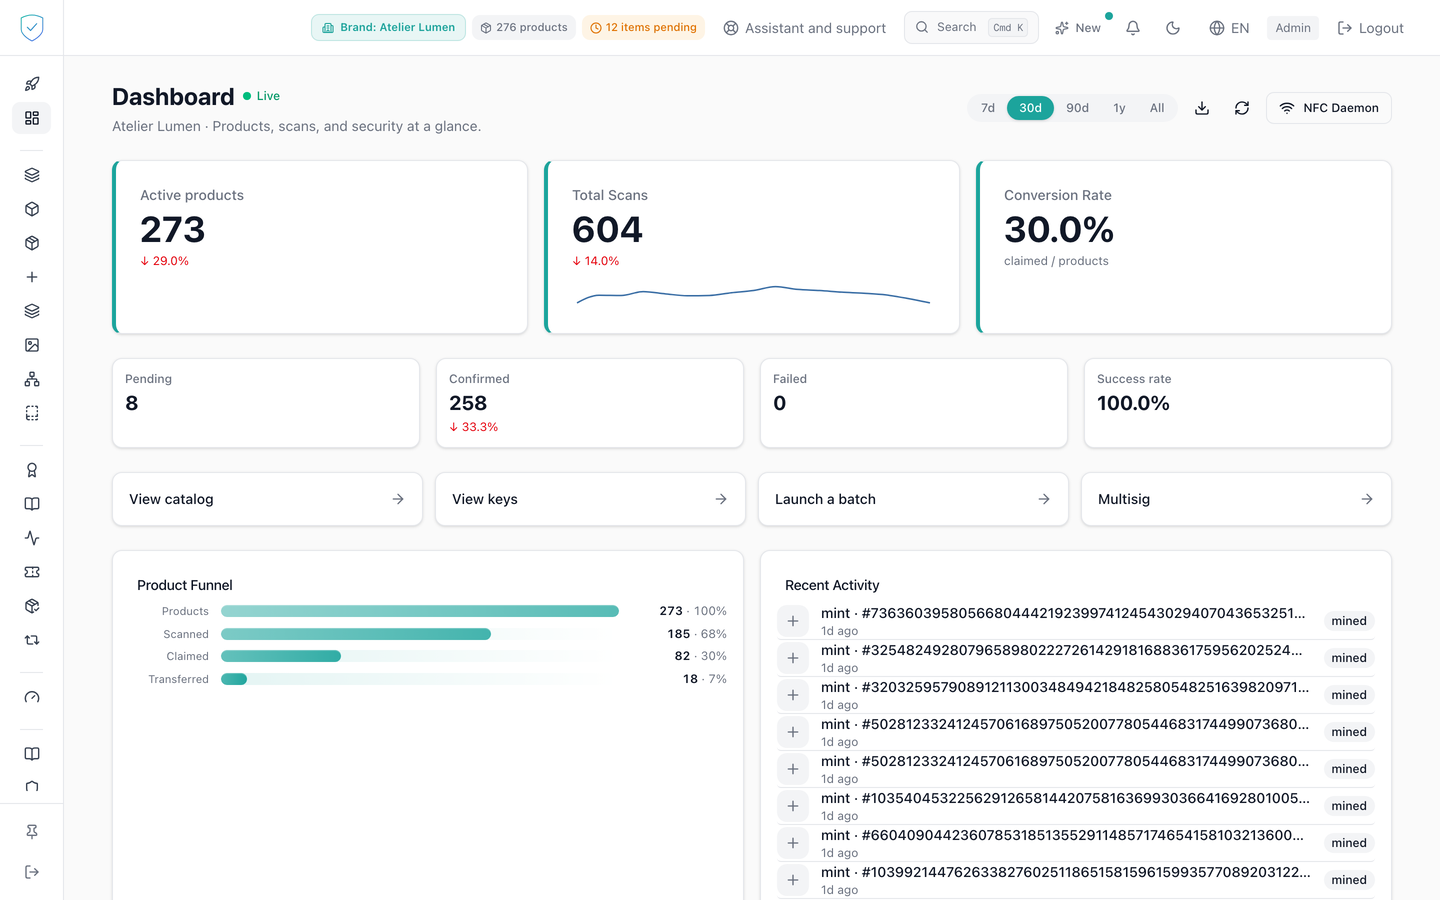
This is the console's home screen after signing in. Over a chosen period, it brings together the indicators of the brand picked in the brand selector of the top bar: what needs attention, passports, items, the scan map, model completeness and operations. A real-time connection asks the server for the counters again when a scan or an alert arrives: the figure shown always comes from the server, for the brand on screen, never from an addition made in the browser.
#What the screen shows
On the very first visit, a window asks how you intend to use the platform: two profiles on the Compliance + Identity offer, passports and piece tracking, or the whole path chip encoding included, and a single one on the Compliance offer, the passport. The choice only decides which sections the left menu shows, and it can be changed at any time from Settings → Brand. "Decide later" postpones the question by seven days; it never comes back once a profile has been picked.
Header: the title "Dashboard", a "Live" pill while the real-time connection holds, the period selector, 7d, 30d, 90d, 1y and "All", set to 30d on load, then the export, refresh and "NFC Daemon" buttons.
#Which brand these figures are about
Every figure on this page is about one single brand, the one named by the brand selector in the top bar. The subtitle, right under the title, says which one again, so that no figure is shown without saying where it comes from. Pick another brand up there and the whole page reloads on the new one: the tiles, the rows to handle, the map, the curves and the panels, all together. Until the selector has answered, the page stays on its skeleton rather than showing a provisional figure.
A superadministrator account also gets, on the right of the header, a second selector that offers an "All Brands" entry. It is the only place that adds the whole platform up; the one in the top bar only offers named brands. Three things to know:
- while "All Brands" is active, the subtitle announces the global view, and it names no brand;
- any move of the top bar's selector ends the global view and brings the page back to the brand it names, including when you come back to the one you started from. "All Brands" holds until the next move of that bar, and no further;
- that choice is not remembered from one load to the next: reopening the page always starts again on the top bar's brand.
Picking a named brand in that second selector does not apply to this page alone: it moves the top bar's brand, so the rest of the console follows.
The page reads from top to bottom, in this order:
- Needs attention: what calls for an action, most serious first;
- Passports · brand: four tiles about passports;
- Items and chips · brand: four tiles about items, then the blockchain registration;
- Where your items are scanned: a small map;
- Completeness by model and Item journey;
- Recent Activity, the offer in a single My plan card (see Plans and limits), Operations and, for the superadmin, Technical details.
The brand's name appears once per group, in its title ("Passports · Lumen Atelier"). A tile says what it counts and over which period; in the "All Brands" view it adds "· all brands".
#Needs attention
One row per thing to do, with a colour band on the left and a link that says what it opens: "See the copies", "Publish", "Complete", "See the plan"… Red: a danger still open. Orange: something to fix. Grey: advice. The severity is also written, for anyone who does not see colours.
- Possible copies to review (red): the alerts still open, under review or confirmed. An alert settled or marked as a false alarm lights nothing.
- Items reported stolen (red): the thefts still open, declared, frozen on the blockchain or revoked. A recovered item lights nothing.
- Open gray-market alerts (orange), on the Compliance + Identity offer only: the "New" or "Investigating" alerts. A confirmed or dismissed alert lights nothing. The "See the alerts" link opens the "Gray market" tab of the Distribution screen.
- Failed blockchain registrations, operations to sign, failing webhooks, models without a live passport, items ready, not yet registered on the blockchain (orange).
- Quota, on the Compliance + Identity offer only, since the included volume counts items: from 90 % of the items included in the year, a grey piece of advice, because on the Compliance + Identity offer each item beyond is billed, never refused; on a monthly volume, an orange row, because it is a real limit.
- Anyone can claim your items (grey): the brand has no claim rule at all. An existing rule whose every condition is switched off is not detected.
- White label: logo or colour missing (orange): only for a brand that removes the SealTrust mention.
These rows do not depend on the period: a copy open for ten days stays on screen in "7d". Beyond 5 rows, a "+ n more" button unfolds the list; a red row is never folded away. With nothing to do, the row reads "Nothing needs attention right now." A number the server could not give lights nothing and never reads "0".
#The tiles
- Models; Live passports: the number of models that have a version published at the model level, never the total number of passport rows; Average completeness, with its ring, whose colour changes at the 80, 60 and 40 thresholds, a SealTrust score on 7 criteria, publication and proofs included; Model and batch code scans · in September, the current month, named.
- Items in circulation: the brand's items, without the rows replaced by a re-registration of the same chip, and without archived or destroyed items. It is a state: the period does not change it.
- Item scans: one verification per scan, either an NFC chip checked by the server or the page opened from an item's QR code. The robots that open a shared link to build a preview (WhatsApp, Slack…) and the technical steps of an NFC reading do not count. A refused verification, a replayed chip for instance, does count: someone did scan. The period is rolling and ends now: "last 30 days" means the last 30 × 24 hours.
- Possible copies · to review and Reported stolen: the same open numbers as the red rows, with no period. Above zero, the tile carries a red rule on its left.
Under the item tiles, three links tell the blockchain registration: in progress, done, failed. Failures are orange, never red: they are to fix, not a danger.
These numbers are not the billing ones. The usage statement counts the items created in the month and the successful scans of the calendar month, under its own rules.
#The map, the completeness and the journey
The small map is a still drawing, the same world map as the public site, with no tile server. It draws the 200 most active areas of about one kilometre over the period. A scan whose device sent its position is a dot; a scan known only by its network is a ring, an approximate zone around the centre of its town, never a dot; a scan from a server network is counted without being drawn. Below the map, "of which N by GPS" counts the dots only, and the zones are counted apart; when no scan can be placed, the map says so. The world map stays whole at every screen width, from a phone to a large screen. The whole map leads to the Scan map page.
"Completeness by model" lists the 5 least complete models, with their live version and their score, then a link to all of them. In the "All Brands" view, a column gives each model's brand. "Item journey" counts since the start, with no period.
The "Webhooks" pill reads actual deliveries, not the activation switch: it says "Healthy" when no active subscription has stopped delivering, "Failing" when they all have, "Degraded" in between, and "Healthy" when there is no webhook at all. The "Team" card counts only active accounts that carry administrator rights.
#Technical details (superadmin)
A block closed by default. Its data loads when it is opened, not with the page. "Blockchain" counts ownership changes there: the mint, which leaves from the null address, is not one. "MFA adoption" reads the brand's whole team, whether a person is attached directly or through an invitation, and only counts two-factor authentication that is actually switched on. An empty team reads "No one in the team", not 0 %. The "Monitoring" link is there too.
In the "All Brands" view, a "Products by brand" chart is added; the rows that belong to one brand (models without a passport, items ready, quota, claims, white label) are hidden, and the code scans tile shows a dash with "Choose a brand".
#What you can do here
Change the period. Each change fires the data call again, as does the refresh button, bearing in mind that the main counters and the recent activity block stay cached for 60 seconds on the server side.
⚠️ A blockchain operation we cannot tie to a contract does not appear in your recent activity. A token number alone does not identify a product: it is only unique within one contract. Rather than risk showing another brand's operation, we show fewer of them.
Export with "Export CSV" or "Print PDF". The file is named sealtrust-dashboard followed by today's date, and any cell starting with =, +, - or @ gets an apostrophe, so a spreadsheet does not read it as a formula. The file is UTF-8 with a byte order mark (BOM), so that Excel reads accents as they are.
Click a tile or a row to open the screen concerned, already filtered. The three blockchain registration links count the state of the token's on-chain write, which is a different quantity from the unit's lifecycle status: they therefore open the product list on the write state filter, not on the status one. A "Recent Activity" row names the operation (token created, transfer, claim, token destroyed) and its state (pending, sent, confirmed, failed), and opens the record of the product that holds that token in the brand shown. An operation whose token no product holds is shown without a link. An operation is shown once, even when several records share its token after a re-mint: the link then opens the record in service, not the one it replaced. An operation the console does not know yet reads "On-chain operation", and an unknown state "Unknown status", never their internal code. With no item at all, a "Welcome to SealTrust" card offers to create a first one; it goes away as soon as one exists.
On the Compliance offer, the brand has no items: the dashboard keeps "Needs attention", the "Passports" group, "Completeness by model", the offer and the operations, and shows neither the "NFC daemon" button, nor the items and chips group, nor the map, nor the journey, nor the "Recent Activity" panel, nor the "Launch a batch" and "Multisig" shortcuts. "Needs attention" there only shows webhooks, models without a live passport and the white label. The welcome card offers to create a first model while there is none. See Compliance, or Compliance + Identity.
#What controls access
You need a signed-in administrator account. Until authentication is resolved, the page shows only a skeleton. No plan locks the screen. For an account that is not a superadmin, if the list of brands could not be read, the page asks for no figure and shows "Choose a brand": it never adds up the account's brands.
#What the screen refuses
An account that is not an administrator sees the message "Unauthorized. Please log in at www.sealtrust.io (nouvel onglet)." and a "Log in" button.
A block unavailable on the server side does not prevent the rest of the page from displaying: its tile shows a dash, never zero. If the global call fails, a red banner shows the detail returned by the server, failing that the request's technical message, and as a last resort the text "Error loading dashboard".
Dashboard percentages are written in the console's language: "40.0%" in English, "40,0 %" in French. If the real-time connection drops, a banner announces "Real-time updates disconnected. Data may be stale."
Was this page helpful?
Your answer opens a pre-filled email in your mail app, addressed to contact@sealtrust.io. You read it over before sending it.