

Analytics
Track, over the period of your choice, the product funnel, the scan, claim and transfer curves, the geographic distribution and the ranking of the most active products.
The "Analytics" screen measures the activity of your products over a period you choose: how many exist, how many have been scanned, claimed, then transferred. It only reads, no button on it changes any data.
#What the screen shows
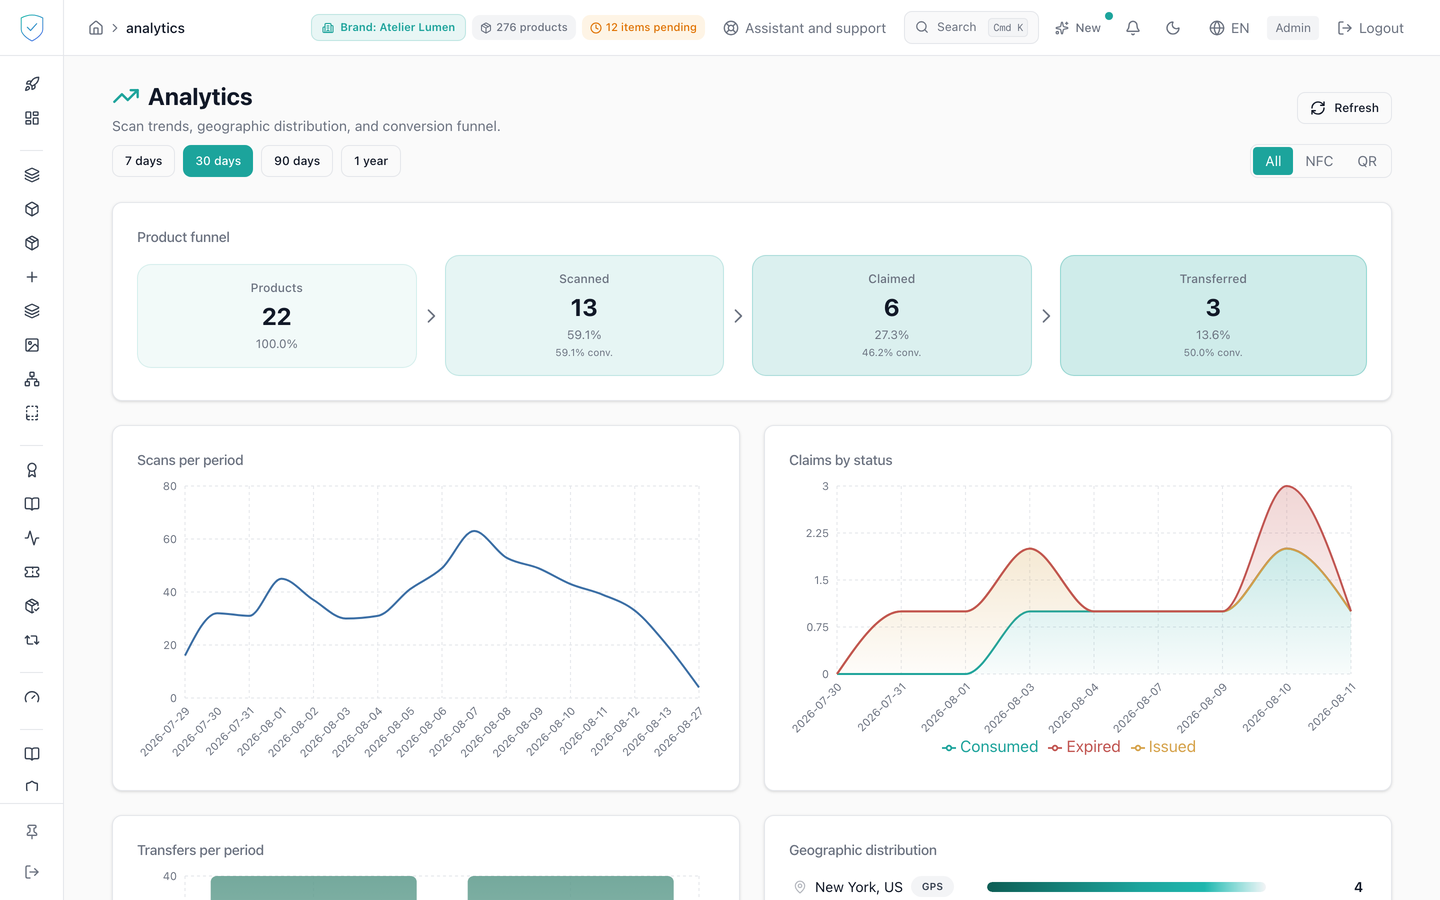
Four period buttons drive everything else: "7 days", "30 days", "90 days" and "1 year". Next to them, a three-position channel selector: "All", "NFC", "QR".
The "Product funnel" band has four stages: "Products", "Scanned", "Claimed", "Transferred". Each one gives its number, its share of the first stage and, from the second one on, the conversion rate from the previous stage.
Then come a "Scans per period" curve, which counts scans the way the
dashboard does (one verification per scan, without
link-preview robots or the technical steps of an NFC reading), a "Claims by status" stacked area with
the Consumed, Issued and Expired series, and a "Transfers per period"
histogram.
The "Geographic distribution" panel lists at most 10 places. Each row carries the place, a "GPS" or "≈ approx." label, a proportional bar and the number of scans. A link below it opens the scan map, except on the Compliance offer, where that map does not exist.
The "Most active products" table has four sortable columns: "Product", "Scans", "Claims", "Transfers". When the period holds nothing, the page shows "No data for this period".
#What you can do here
Change the period, which is 30 days when the screen opens. That choice also sets how the curves are grouped: one point per day over 7 and 30 days, per week over 90 days, per month over 1 year.
Restrict the observation to the NFC channel or to the QR channel; the selector starts on "All". The channel applies to the scan views and to the geographic distribution. Claims and transfers stay counted across every channel.
Sort the table on any of the four columns. It opens on scans, from the largest to the smallest. A second click on the active column reverses the order. A click on another column starts again in descending order.
"Refresh" restarts the six reads of the page.
#What conditions access
The "Analytics" entry sits in the "Analysis & Audit" section of the sidebar. It carries no plan lock and no profile hiding. The content only appears once the session is ready and the account is recognized as an administrator. The figures are bounded server-side to the brands of your account.
#What the screen refuses
An account that is neither an administrator nor an operator is refused, with the message "Administrator access required".
The six reads leave in parallel, each one protected: the one that fails leaves its card empty without taking the others down.
The geographic distribution only keeps the sdm_verify_url and qr_scan
steps. NFC session telemetry, waiting_for_tag, ndef_read and
ndef_read_failed, is left out of it, as are the link-preview robots.
The funnel only counts active products: retired statuses and burned leave the
cohort. A product only enters "Transferred" if the transfer starts from a
non-null address that differs from the destination address, which rules out the
initial mint and transfers to oneself.
The table's "Transfers" column applies exactly the same rule. Until 19 September 2026 it counted every transfer row, the mint included: the funnel read "Transferred: 0" while the table, on the same page, showed 1 per product. Both figures now share a single definition, and a product that was never resold stays in the table with a zero instead of disappearing from it.
The product ranking returns 20 rows by default and 100 at most. The geographic distribution is read in pages of 200 places.
Was this page helpful?
Your answer opens a pre-filled email in your mail app, addressed to contact@sealtrust.io. You read it over before sending it.