

The security dashboard
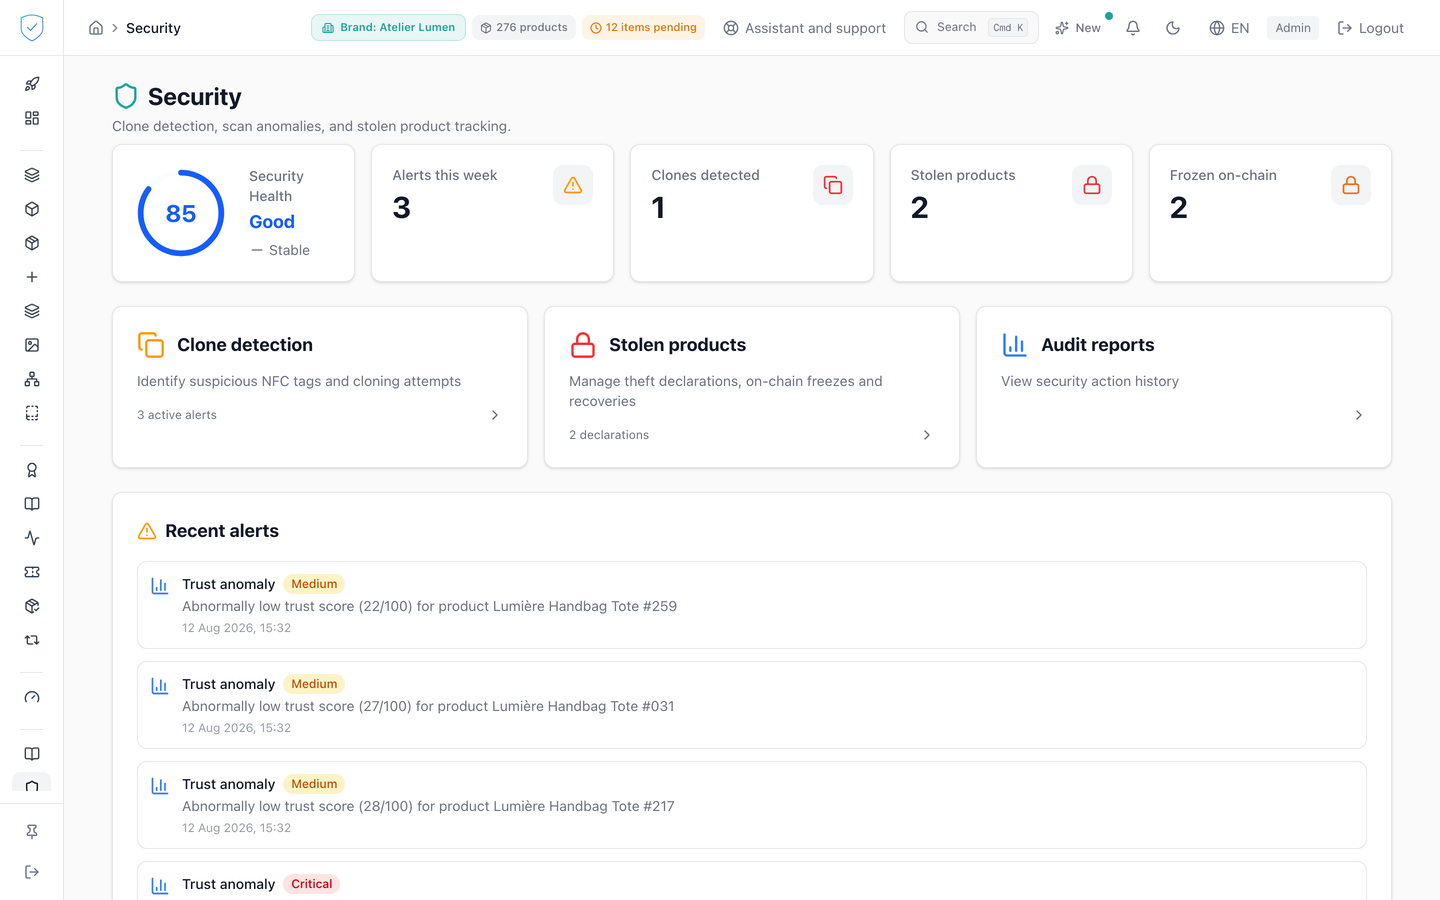
The security landing page: a health score, four counters, recent alerts, a live feed and geographic activity.
This screen answers, at a glance, the question "is anything going wrong right now". It brings together clone alerts, theft declarations and products with a low trust score. It fixes nothing itself: each shortcut leads to the screen that can act.
#What the screen shows
The "Security" header, subtitled "Clone detection, scan anomalies, and stolen product tracking."
A circular "Security Health" badge: a score from 0 to 100, a rating and a trend. The score starts at 100, removes 5 points per clone alert up to 30, 10 per critical clone up to 20, 5 per stolen product up to 25, adds 15 points if the average trust score reaches 80, 10 from 60, 5 from 40, removes 10 below 40, then adds up to 10 points depending on the share of declared thefts actually frozen on the blockchain, a share worth 1 when no theft is declared. The total is then brought back between 0 and 100.
Once the statistics are loaded, the rating is "Excellent" from 90, "Good" from 70, "Fair" from 50, "Poor" from 30, "Critical" below. As long as no statistics are available, the badge shows 0 out of 100 with the rating "Fair".
The trend only moves if the gap with the previous measurement exceeds 2 points. As the statistics are loaded only on opening, there is in practice no previous measurement: the comparison is made against 0 and the trend shows "Improving" as soon as the score exceeds 2.
Four counters: "Alerts this week", "Clones detected", "Stolen products", "Frozen on-chain". Then three shortcut cards, to clone detection, stolen products and audit reports.
A "Recent alerts" block mixing clones, thefts and trust anomalies, each with its severity pill and its timestamp. It keeps the 20 most recent events and shows 5 of them at first. A trust anomaly is rated critical when the score is at or below 20, medium above.
A "Live Feed" block, a blinking green dot when the real-time connection is established, keeping at most 50 events and scrolling on each new arrival.
A "Geographic Activity" block: the 8 most scanned countries with their proportion bar, and at most 3 cities per country. Scans are grouped there by small areas, bots excluded. The block follows the brand picked in the top bar; with no brand picked, it shows nothing.
#What you can do here
Expand the recent alerts with "Show more", collapse them with "Show less".
Open clone detection, stolen products or the audit log through the three shortcut cards.
#What governs access
You must be signed in and an administrator. Otherwise the console replaces the page with "Unauthorized. Please log in at www.sealtrust.io (nouvel onglet)." and a sign-in button. No plan feature is required.
Everything is limited to the brands you have access to. Internal tags, for demonstration, showroom or training, are set aside from recent alerts and counted separately.
#What the screen refuses
If only one of the three alert sources fails, the other two keep showing. The message "Failed to load alerts" appears only if the whole block breaks.
With no alert, the block shows a green tick and "No recent alerts". With no event, the feed shows "No live events yet". With no location data, the geographic block shows "No geographic data available".
If the statistics computation fails, the server answers Erreur chargement statistiques sécurité. That sentence is written in French in the code and served as it is, whatever the language of your console. The real-time connection re-establishes itself, with a delay that doubles on each failure up to 30 seconds.
Was this page helpful?
Your answer opens a pre-filled email in your mail app, addressed to contact@sealtrust.io. You read it over before sending it.